Welcome to the hardest game there is.
And you’re playing it against some of the sharpest, fastest, best-informed — and often most stubbornly irrational, sometimes flat-out unethical — minds on the planet.
There’s a machine that reacts before you’ve finished the thought. A trader who’s lived through more cycles than you. A fund that can move size you’ll never touch. An insider who knew before the headline did. A crowd whose job is to get you leaning the wrong way. And the voice in your own head, quietly working to undo you.
So leave the dream of fast, easy money at the door.
The first aim is survival. Before anything else, you learn how to stay in the game.
You do that by mapping the terrain. By learning how the other side thinks and moves. By showing up with a real plan. And by picking your battles very, very carefully.
Here’s the honest part: I’m not a market genius. It’s a bull market, idiots. My edge is boring — I reckon if you can read a traffic light, stop on red and go on green, you can do just fine in this market too.
Ready to play?
The whole record — green years and ugly days
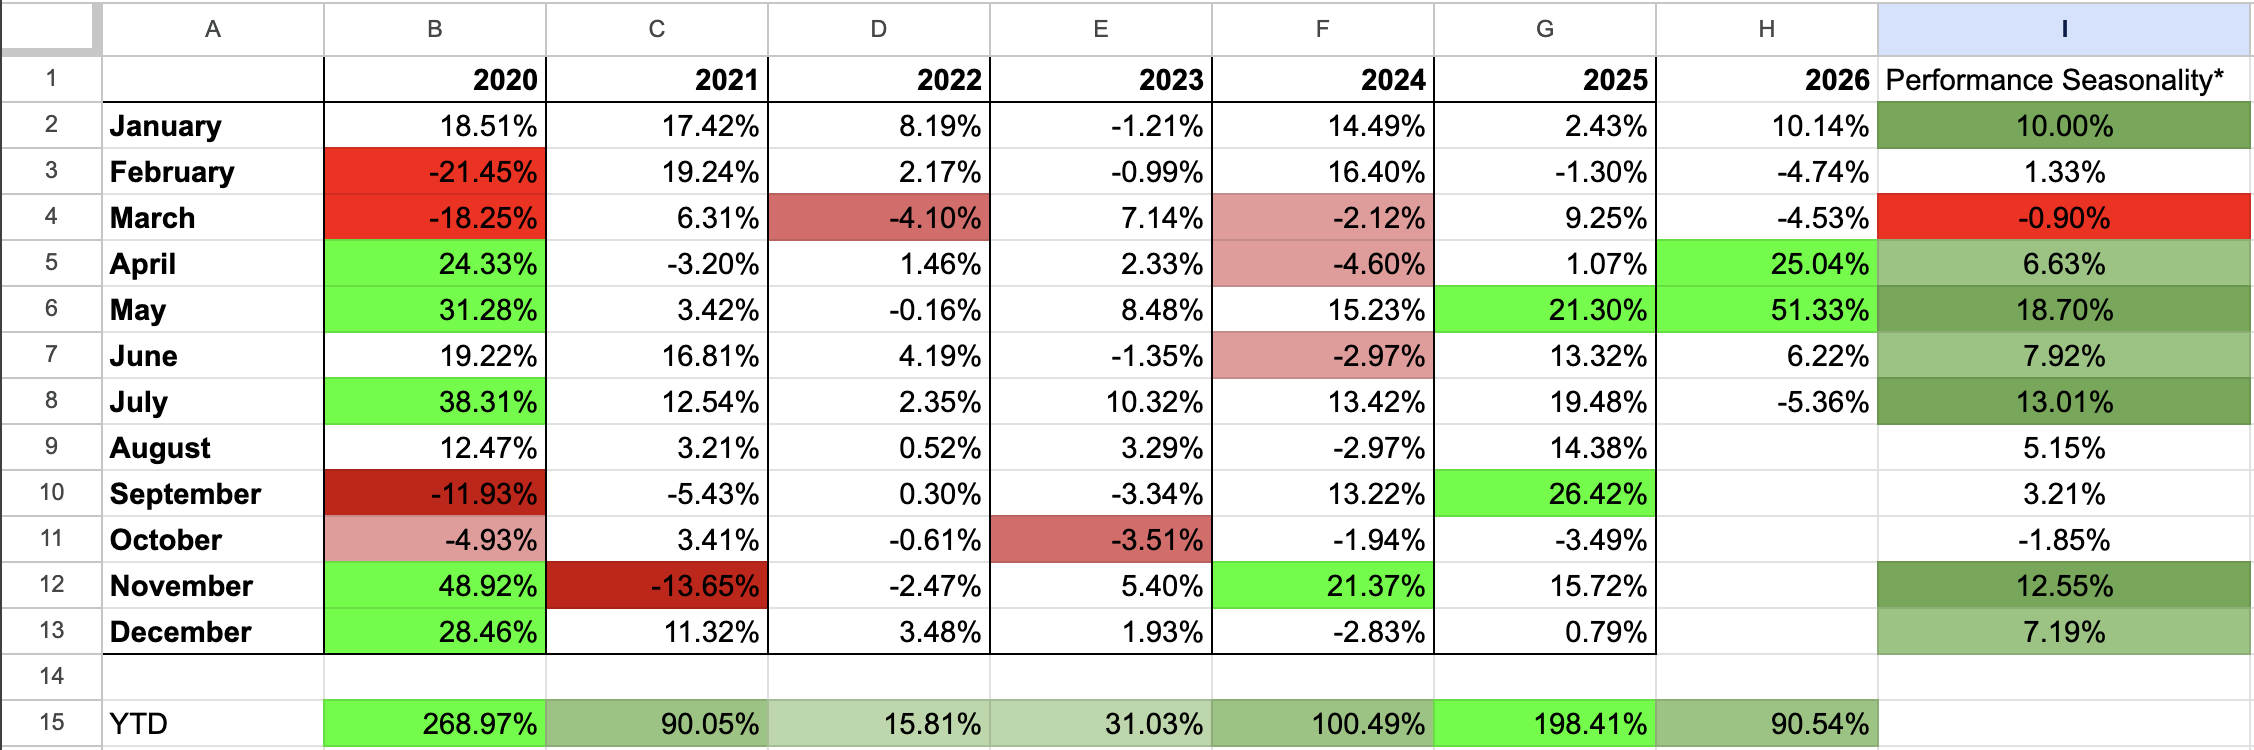
I’m a systematic momentum swing trader — US equities, 5-7 day holds, one real account., no futures or options trading, common shares only. I log every fill, mark it to market, and let the numbers speak. This isn’t a highlight reel. It’s the full year-by-year record since 2020, drawdowns included. All trade details are logged and verified in the discord group.
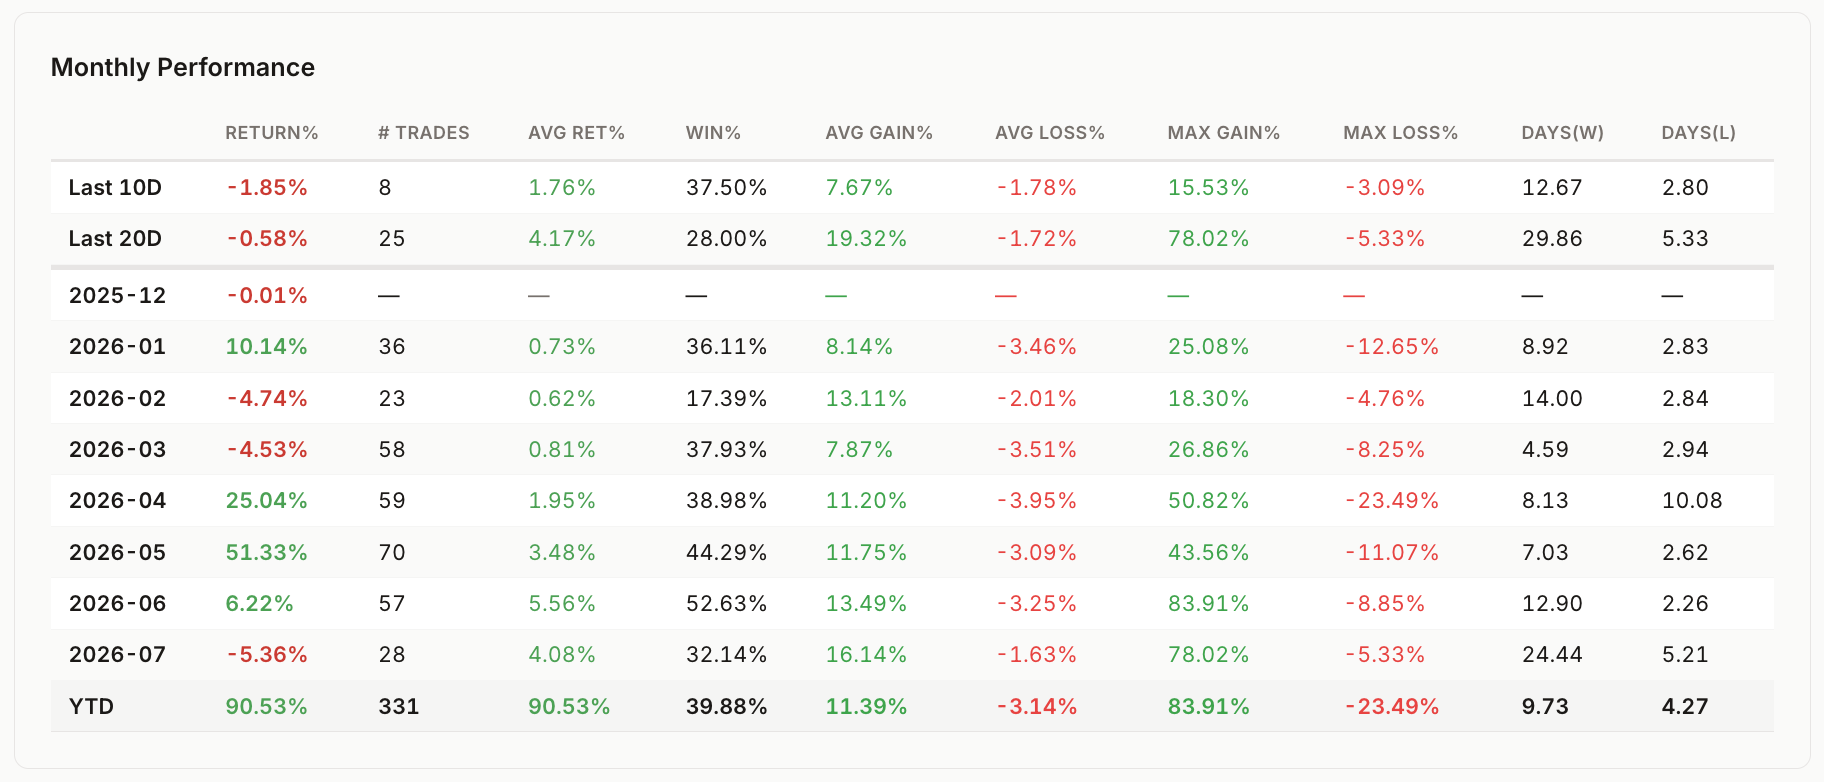
2026 year-to-date — the full detail
Jan 1 – Jul 22, 2026.
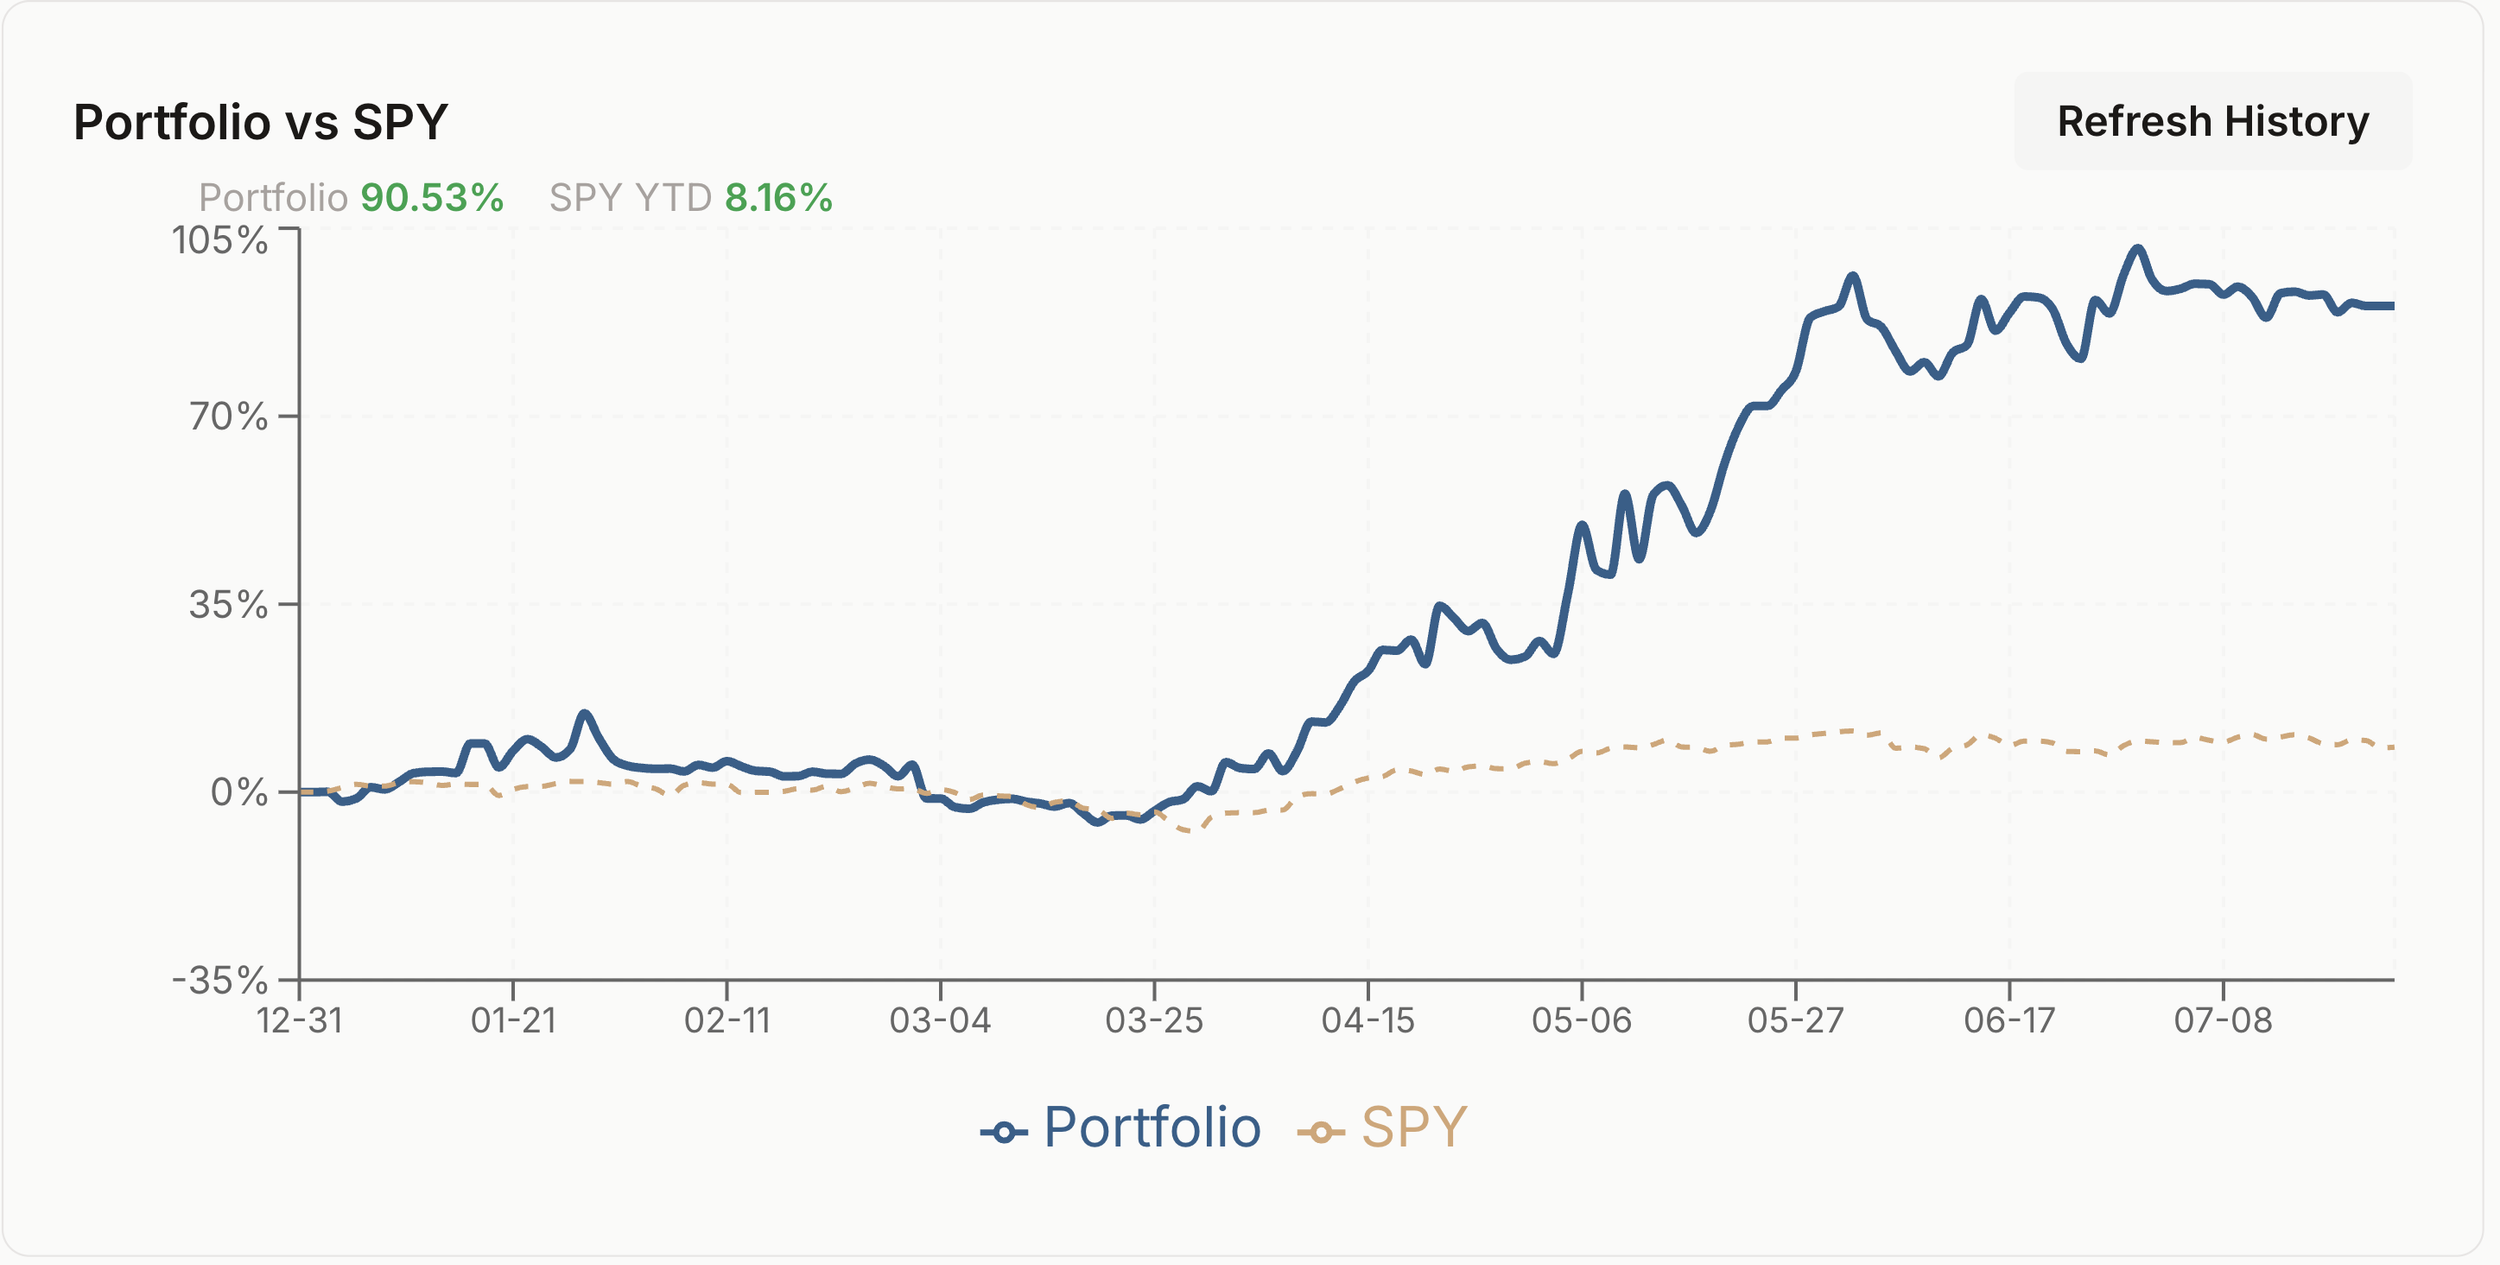
YTD +90.5% | Win rate 39.9% | Profit factor 2.48 | Avg winner $ vs avg loser $: 3.40 : 1
Max drawdown −18% (mark-to-market) | Sharpe 2.6 | 331 trades closed | Avg holding duration 7.5 days
Methodology note (Aug 2026): this line previously read -11%. That was the percentage of the largest dollar drawdown - a June episode, measured on a bigger account base. The standard here is the deepest peak-to-trough percentage decline of the daily mark-to-market curve: -18%, Jan 28 to Mar 19. A drawdown metric should make you look worse, not better - so -18% is the number that stays.
How I trade
I don't have opinions. I have measurements. A ~40% win rate means the market tells me I'm wrong more often than right, and I believe it. The edge isn't being right; it's that the winners run about three times the size of the losers, and over 331 trades that gap is the whole business. From outside it looks like a hot streak. From here it's arithmetic.
Size comes from the stop, never from conviction. Before I enter, I risk a fixed 0.25% of equity. The stop goes on first and the position is sized backward from it, so how sure I feel never touches how much I can lose. That's the plan on every trade.
I let winners run — the hardest thing here. I held DOCN 86 days for +17.4R, one of the biggest trades of my year, because nothing I measured said to get off; ALAB ran +21R over six weeks for the same reason. The account is carried by a handful of leading names I refused to sell early.
I'm wrong constantly, and at peace with it. I took eight swings at BE and connected on about a third. The one that mattered went on April 8, into the capitulation the whole herd was selling — +7.3R, enough to pay for every failed poke at the name and then some. Stay cheap when you're wrong, so one measured strike can carry the rest.
When breadth rots, I sit. I trade the green light and nothing else, and let the Algo Monkeys sell what their risk limits force them to sell. Sitting is a position. This page exists because I keep the receipts — a number you can't check is just a claim.
I show the losses too.
A track record without them is a highlight reel, and a highlight reel teaches nothing. Most of my losses are small and fast — that's the defense, not an accident. The average loser costs about 0.6% of the risk I planned for it and is closed within four days; across all 331 trades, only seven ever got past twice my risk. Losses are supposed to be boring, and mine mostly are.
The exception was BABA. I bought it, I was wrong, and instead of cutting at the stop I let it sit for three months while it bled to −5.7R — twenty-two times the risk I'd planned. Five attempts, not one winner, more than a month of the account's profit. It didn't cost that because the idea was bad; it cost that because I stopped measuring and started hoping.
That's the whole distinction on this page. Wrong-and-cut is routine — small, fast, forgotten by Friday. Wrong-and-held is rare — one slow, expensive lesson in what happens the moment you trade your opinion instead of your stop. Both get the same autopsy: what I measured, what it cost, what changed.
Past performance is not indicative of future results. This is a personal trading record shown for transparency — not advice, a signal service, or an offer. Trading involves substantial risk of loss.
Last update: 8/12/2026.